Copernicus Sentinel III
Surveillance of Drought resistant areas with Photosynthesis remote sensing
Use of radiation sensors to preserve soil moisture in California and Australia
Report data updated on October 10, 2021
Surveillance of Drought resistant areas with Photosynthesis remote sensing
Use of radiation sensors to preserve soil moisture in California and Australia
Report data updated on October 10, 2021
Contact: fernando@astst.info
Despite the severe drought conditions that have affected California from
January 2020 to up-to-date in October 2021 according to the US Drought
Monitor; photosynthesis remote sensing has identified a high resistance
region in Corte de Madera, California. It is worth doing continuous
satellite surveillance of this region supported by drones and earth
sensors to help to preserve these resilient regions that could be
the water reserves shortly.
The purpose of this project is to provide a minimum of continuous
10-day surveillance of these resilience regions in California and
Australia to show how satellite remote sensing could be used for
sustainability and as an Early Warning System of wildfires risks
in case these areas start to lose photosynthesis and vegetable
activity.
This information is updated as of October 10, 2021.
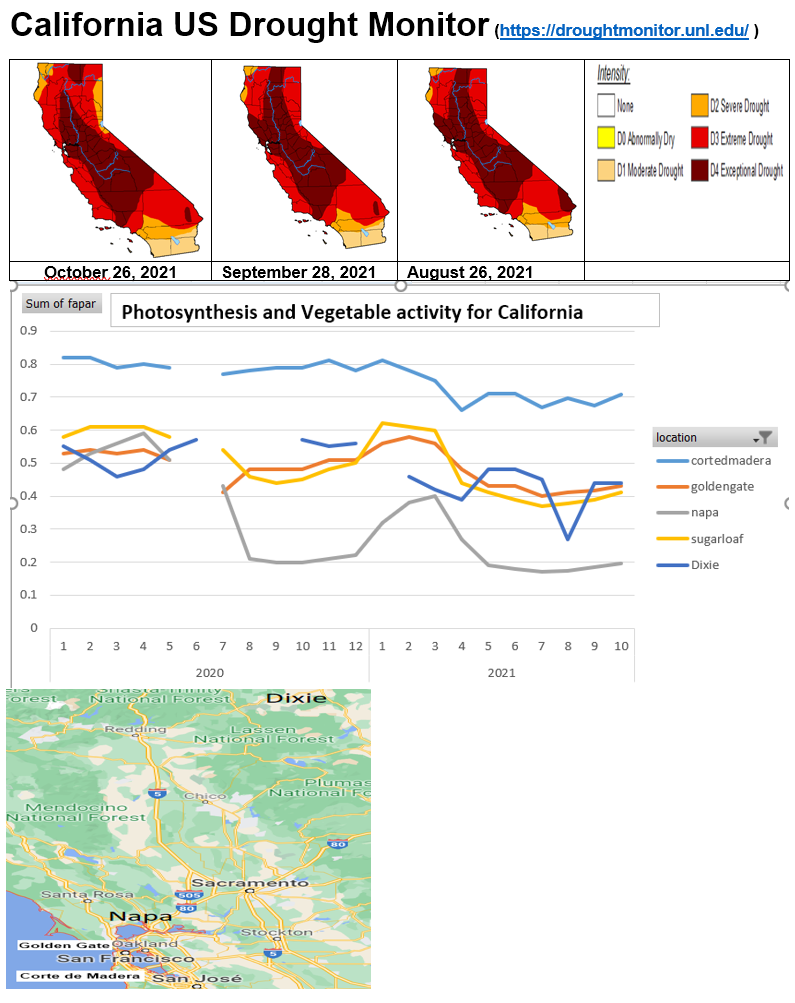 Figure 1: Vegetable Activity California October, 2021
The information is provided in the context of other regions of California
and Australia. For example, Napa Valley has a low vegetable activity during
the rainy season (November to April) of the year 2020 due to the drought
conditions. It suffered wildfires in October 2020. Up to date (October 2020)
its photosynthesis activity has not yet recovered to the levels before the wildfires.
The same situation was for the Dixie region that suffered big wildfires in
August 2021. It has a low vegetable activity during the rainy season.
Golden Gate and Sugar regions in California have a low photosynthesis
indicator for 2020 and 2021. The only exception is Corte de Madera
because this area keeps a healthy vegetable activity despite
the crisis confirmed by the US drought monitor images.
Also, the eastern coast of Australia has high resilience to severe drought
conditions. It resisted the drought of the year 2019 with relatively high
photosynthetic and vegetable activity meanwhile the inland was suffering
from wildfires.
This information is updated as of October 10, 2021.
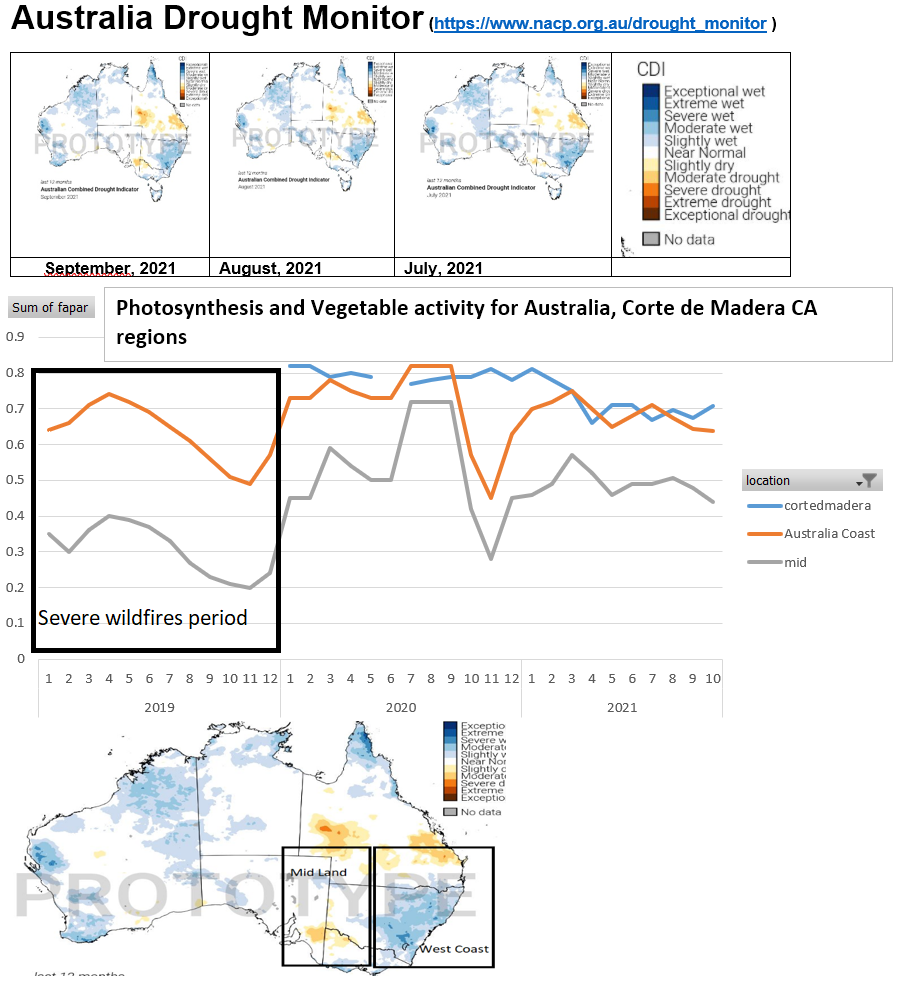 Figure 2: Vegetable Activity Australia October, 2021
In figure 2 we see that during all the year 2019, the midland of Australia
suffered from a big loss of vegetable activity and was affected by severe
wildfires. The west coast of Australia, Queensland, had a high resilience
to the lack of moisture and resist pretty well the crisis.
Then with the exception of November 2020, the west coast has a high
performance in photosynthesis lasting to the readings of October 10, 2021.
See that the West Coast of Australia and Corte de Madera in California
have a very similar vegetable activity from January 2020 to October 2021.
Also, the Australia Drought monitor indicates that the sub-continent is
not having a crisis at this moment and the moisture levels are normal
or above.
Amplitude and Statistics also can monitor any region of the world with
satellites and NDVI images from drones. We can train your team in
Geographical Information Systems to extract information from geo
files like rasters (GeoTIFF) and vectors(Arcgis shape) files.
Learn more about our course "Geographic Information Systems (QGIS)
to get the vegetable activity performance. Analyzing images from
remote sensors or DRONE NDVI camera" in the video description below:
The course INDEX of contents is:
1 Qgis file types
Working with Raster-GeoTIFF images of vegetable activity and wildfires
Working with vector-SHP files with crops database information
2 Region of interest statistics from Raster and Vector layers
Vegetable activity media and standard deviation from Raster layer
3 Executing query conditions with one or more raster layers
4 Applying QGIS: Resilience to droughts, Wildfires Early Warning
System and biodiversity
5 Calculating the slope as a wildfire risk-factor
6 Working with Coordinate Reference Systems (CRS)