
Material Resource Planning with Machine Learning Grouping Statistics and Excel
Stalled inventory could affect the return of investment because the SKU's are not generating sales.
Material Resource planning is a complex multi-variable problem. Among these variables are:
1) Quantity per season (Seasonal products)
2) Gross revenue per product. Problem: You could sell a large quantity of a product, but with small revenue.
3) Quantity delivered to different locations.
4) Quantity delivered to Clients.
These four variables are generated by every product. The analysis gets more complex if you have several dozens or hundreds of products. For example, see Figure A, Revenue by product.
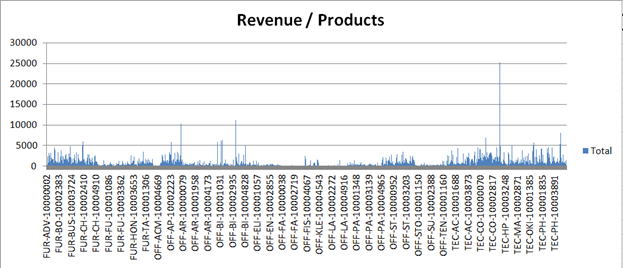 Figure A
It is very difficult to identify what are the products with more rotation and even more complex to know the revenue, locations, and season. With Machine Learning Grouping statistics, we can classify the products by quantity and location. See Figure B, Revenue per Product Groups. With this analysis find the answers to complex questions like what is the location with more and fewer products delivered.
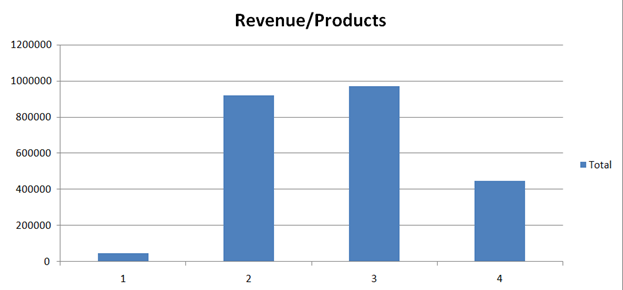 Figure B
Group your data to get accurate segments and Time Series
Segment your market by Revenue, Logistics Costs, Inventory Rotation, and Monthly Season with Excel Machine Learning Grouping Statistics
We have several segments in our market with scattered revenue results.
See figure 1 and check the different earnings for every country.
Generally, we just focus on the main two or three markets but do not have
continuous surveillance for low revenue sectors that could improve with a
specific strategy. In this case, figure 1 shows that our best markets are:
1) Above 100,000
2) Between 50,000 and 100,000
This software module for Excel comes with a Handbook and Video Learnings included.
Learn with this tool how to apply grouping statistics to classify your data as a real-life
concept of Machine Learning. Use a universal tool like Excel together with our software
library on how to apply grouping statistics for your data.
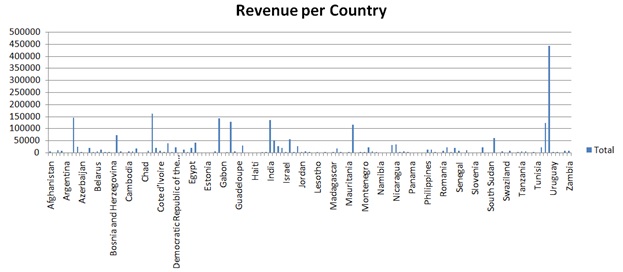 Figure 1
In this course, you will learn the basic knowledge of applying Machine Learning for market
segmentation, using a universal tool like Excel. The course includes:
1) Programming code to run in Excel.
2) Sample data to develop the exercises.
3) Step by step videos and handbook to follow up with the exercises.
So, we need to know what the optimal number of groups or segments and the revenue ranges is of each one.
The Excel Machine Learning tool for this course classifies the market of Figure 1
in four groups or segments shown in Figure 2.
 Figure 2
The best revenue group is number 2.
We get the countries for this group applying Excel Pivot Tables to the segment.
See figure 3.
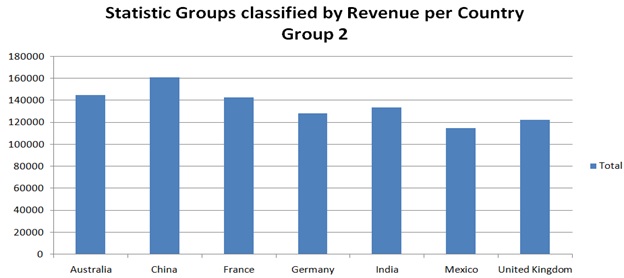 Figure 3
The lowest revenue cluster is number 4. Look in Figure 2. It has a broad number of countries. See figure 4.
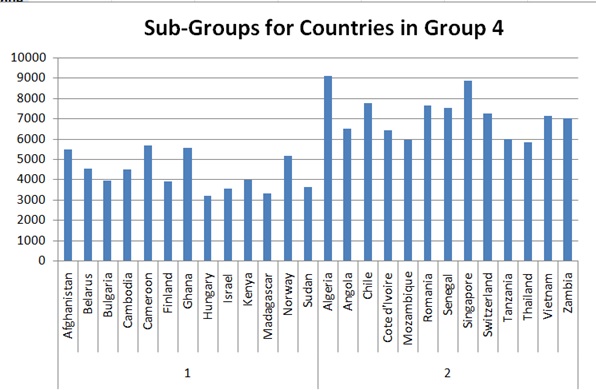 Figure 4
We will show in the course how to re-classify cluster 4 and plan a segmentation strategy for
these low revenue countries and improve their earnings.
See a video demostration of the course below. If you have any questions please write to fernando@astst.info