

Nvidia Rapids: Optimal Logistic Routes and vehicles by quantity, weight, and dimension with Machine Learning
Lux Sigma can solve this complex problem of delivery point routes combined with several variables to optimize the use of transport vehicles in size and capacity. The problem is described in Figures 1 and 2.
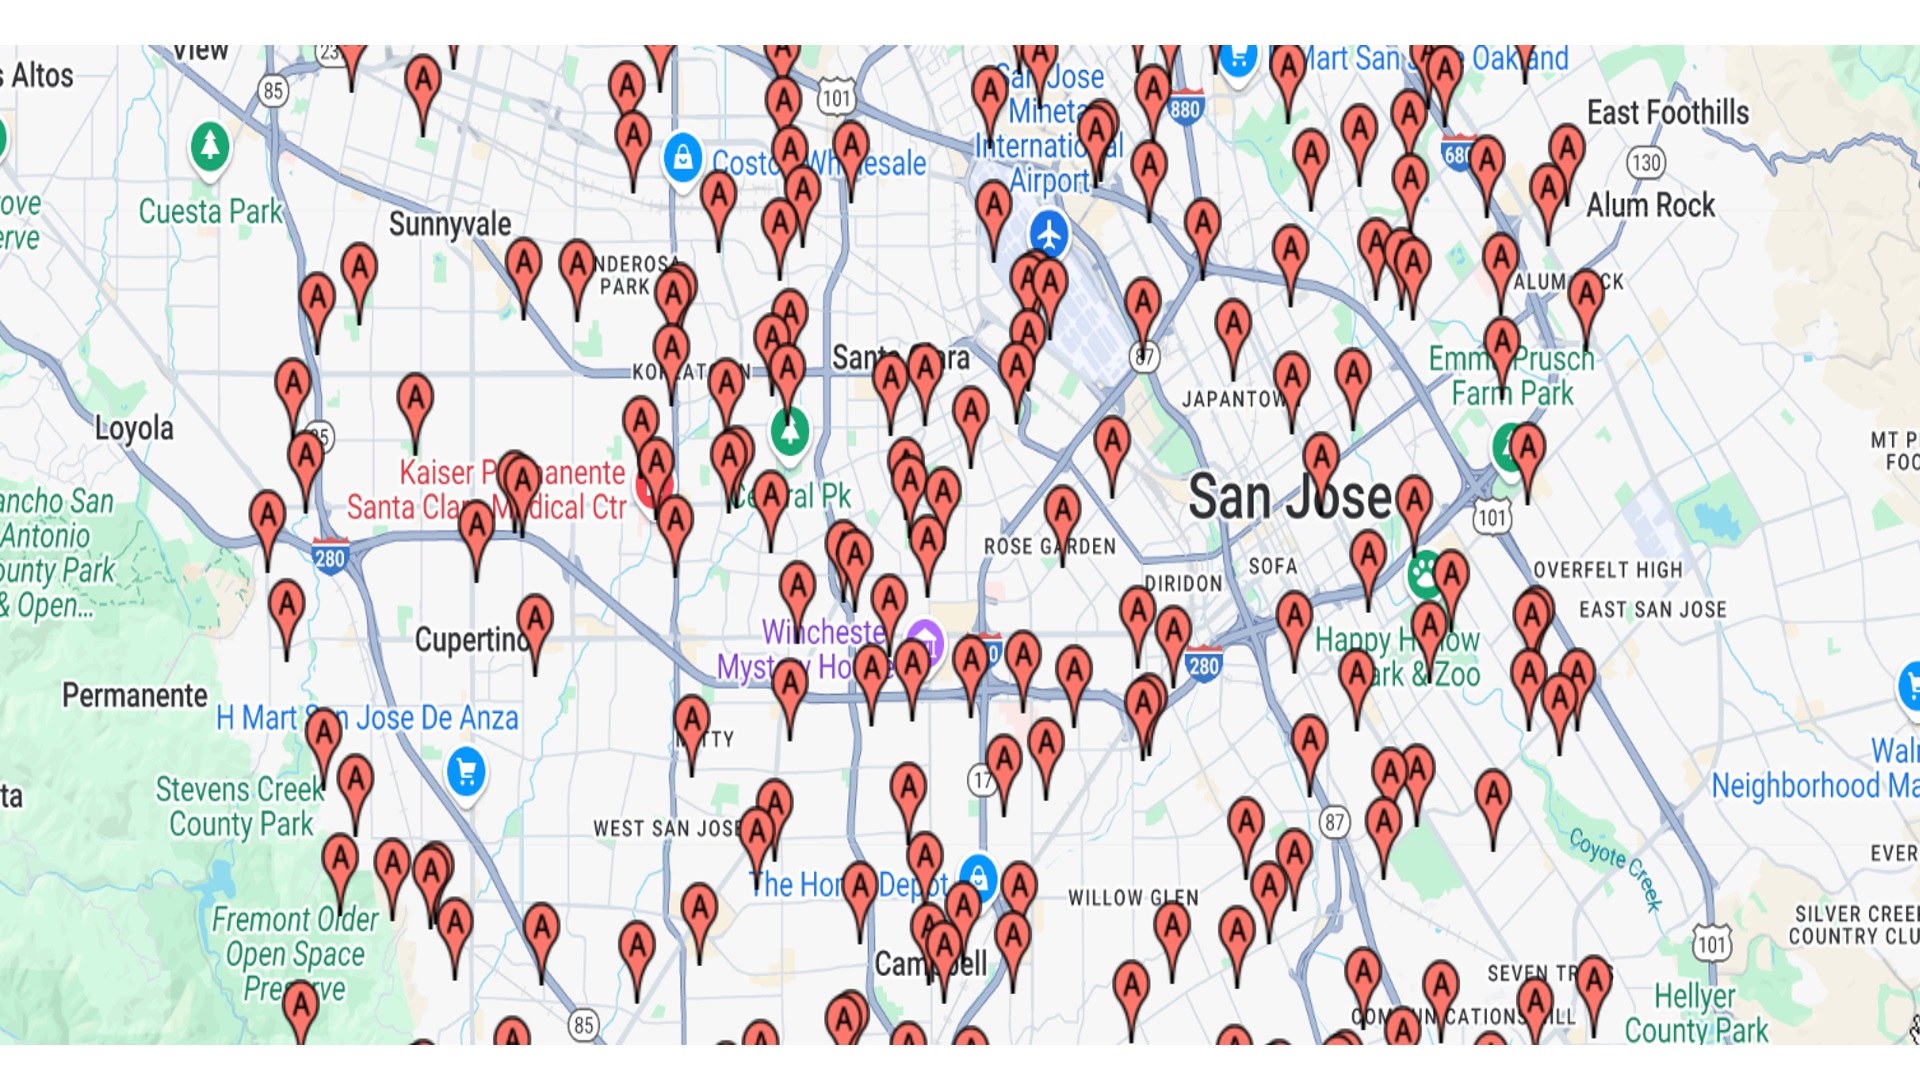 Figura 1
Figure 1: Unclassified delivery point showed in a map.
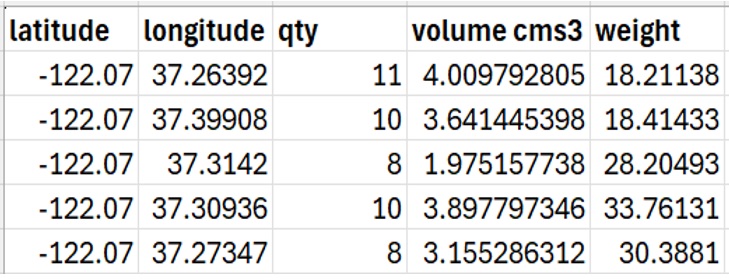 Figura 1
Figure 2: Five variables of logistic routes.
The NVIDIA Rapids Lux Sigma gives the solution of three logistics route segments shown
in three different colors on the map.
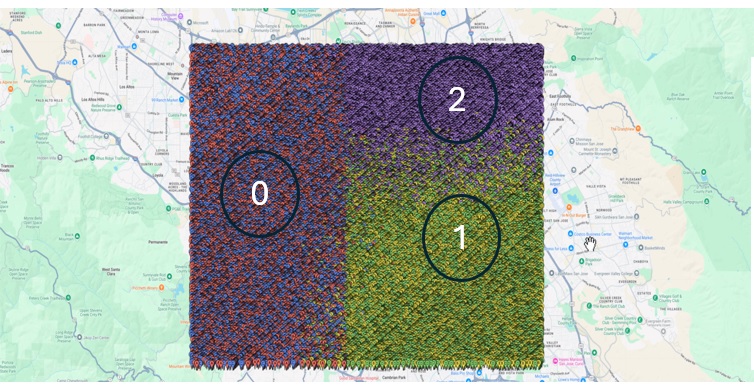 Figura 1
Figure 3:Routes segmentation after using the NVIDIA Rapids Lux Sigma application.
The chart of quantity and weight shows group number two delivers more
quantity of products but groups one and two have more weight.
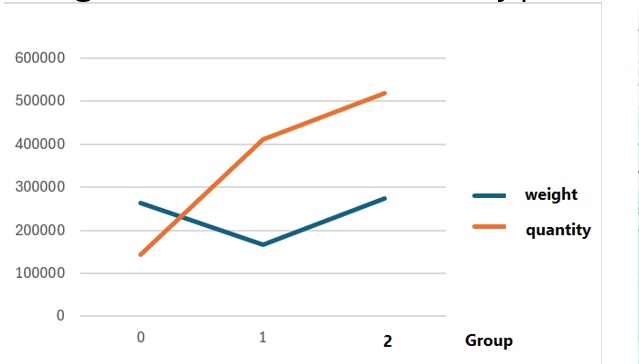 Figura 1
Figure 4:Quantity and weight route group classification.
. In volume in cubic centimeters, group number four needs more space.
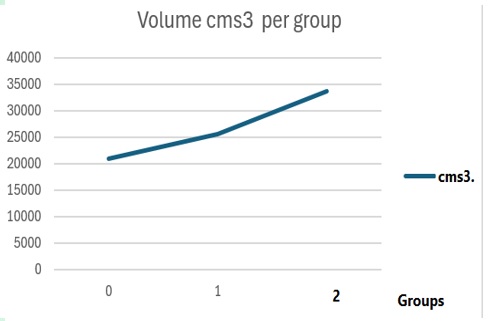 Figura 1
Figure 5:Volume in cubic centimeters route group
classification.
Based on these results, we need vehicles with more space for
group number two for the logistic route of the northeast on the
map because we deliver more products with the highest volume to
this destination.
You can see a video explanation of this applicaition here:
Contact: fernando@luxsigma.info