

Copernicus Sentinel III
Lake Gatun Panama Canal: Machine Learning grouping high vegetable activity regions during the year 2019 droughts
K-Means algorithm classifies European Copernicus Sentinel III imagery data to identify the resilience areas to low moisture
Author: Fernando Roque Facebook: https://www.facebook.com/tutorialespowerbi
Contact: fernando@astst.info
Introduction
Panama Canal had a severe drought crisis during the rainy season of the year 2019 (link).
It obligates to reduce the traffic crossing the Canal. In this research, we applied the Machine
Learning K-Means algorithm to European Copernicus Sentinel III images to classify what
is resilient and the most affected regions during the rainy months of 2019 from May to October.
This research shows the utility of segmentation to define different strategies for a drought
low moisture period event.
The rainy season in Panama is from May to October. We took one vegetable activity image for
each of these months from Copernicus. Figure 1 shows the activity indicator from May to October
for the year 2019 for the Lake Gatun region in the red square of the map.
The indicator has a value range between 0 and 0.96.
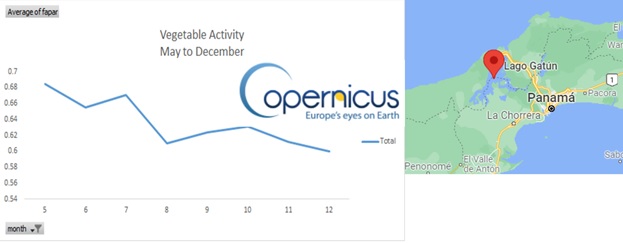 Figure 1: Gatun Lake, Panama Canal Vegetable activity from May to December
Look that the indicator has a severe fall from August to November. Meaning that severe affectation is
caused by the low moisture of the soil. This chart does not segment what is the resilient and the most
affected areas. It represents the average vegetable activity for all the Lake Gatun region.
It is difficult to identify the areas with different levels of vegetable activity during several
months. Review figure 2, which represents the indicator for July and August.
Figure 1: Gatun Lake, Panama Canal Vegetable activity from May to December
Look that the indicator has a severe fall from August to November. Meaning that severe affectation is
caused by the low moisture of the soil. This chart does not segment what is the resilient and the most
affected areas. It represents the average vegetable activity for all the Lake Gatun region.
It is difficult to identify the areas with different levels of vegetable activity during several
months. Review figure 2, which represents the indicator for July and August.
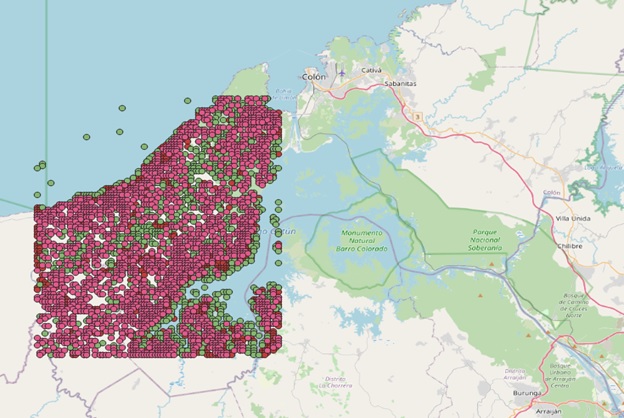 Figure2. Vegetable activity different levels for several months of year 2019. Source Copernicus.
It is not possible to classify the high and low vegetable activity areas from the image at simple sight.
We need a Machine Learning process to classify the region's activity. Figure 3 represents the four segments
or groups returned by the K-Means algorithm based on the values of photosynthesis activity.
Figure2. Vegetable activity different levels for several months of year 2019. Source Copernicus.
It is not possible to classify the high and low vegetable activity areas from the image at simple sight.
We need a Machine Learning process to classify the region's activity. Figure 3 represents the four segments
or groups returned by the K-Means algorithm based on the values of photosynthesis activity.
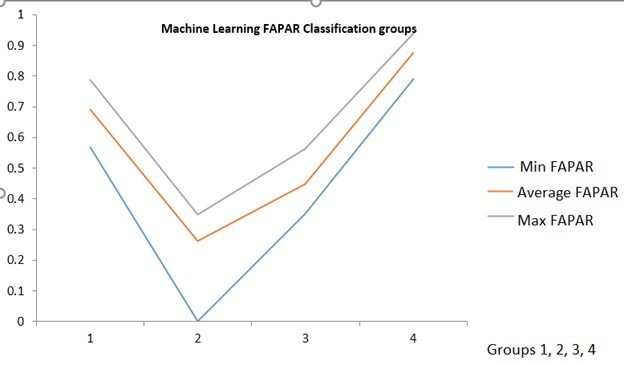 Figure 3. Group’s segmentation of vegetable activity returned by Machine Learning analysis. Source Copernicus.
See figure 3 and review that groups four (0.75 to 0.85) and one (0.5 to 0.8) have the highest value indicator.
Group two (0 to 0.4) and three (0.4 to 0.6) have the lowest indicator value.
In figure 4 we put the numeric values of vegetable activity in map coordinates.
Representing the highest value vegetable activity group in a map in Figure 4A for November 2019
(the end of the rainy season) we can infer that these areas have the resilience to droughts.
Figure 3. Group’s segmentation of vegetable activity returned by Machine Learning analysis. Source Copernicus.
See figure 3 and review that groups four (0.75 to 0.85) and one (0.5 to 0.8) have the highest value indicator.
Group two (0 to 0.4) and three (0.4 to 0.6) have the lowest indicator value.
In figure 4 we put the numeric values of vegetable activity in map coordinates.
Representing the highest value vegetable activity group in a map in Figure 4A for November 2019
(the end of the rainy season) we can infer that these areas have the resilience to droughts.
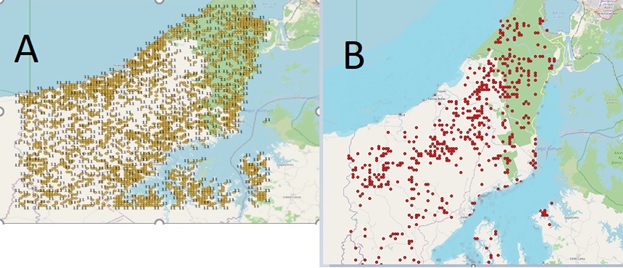 Figure 4A. Resilience region of group four with high vegetable activity in November 2019. Figure 4B. Most affected regions of group two, November 2019.
Look figure 4B has the region with the lowest indicator for November 2019. Representing the most affected areas by the low rainfall.
Charting the number of points of each vegetable activity group in Figure 5 we can see the evolution of the crisis and the loss of
photosynthetic life.
Figure 4A. Resilience region of group four with high vegetable activity in November 2019. Figure 4B. Most affected regions of group two, November 2019.
Look figure 4B has the region with the lowest indicator for November 2019. Representing the most affected areas by the low rainfall.
Charting the number of points of each vegetable activity group in Figure 5 we can see the evolution of the crisis and the loss of
photosynthetic life.
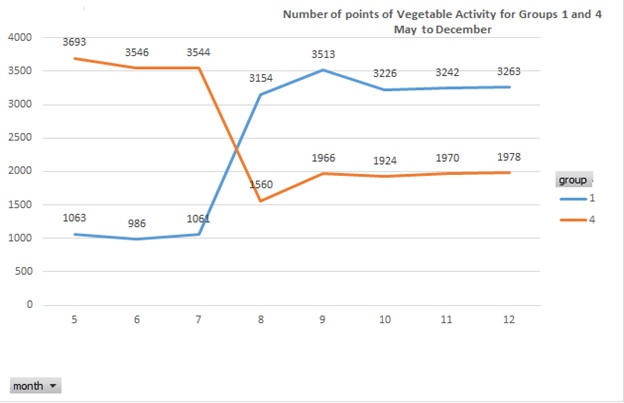 Figure5. Orange line: Number of points of groups 4 (highest vegetable activity). Blue line, vegetable activity indicator second place. Source Copernicus.
Figure 5 see the fall of the number of highest value indicators of group 4 with a range between 0.75 and 0.85 starting in August.
Look that the number of points with a range of 0.5 and 0.8 of group one grows as a result of the loss of vegetable activity life
of group four.
Figure5. Orange line: Number of points of groups 4 (highest vegetable activity). Blue line, vegetable activity indicator second place. Source Copernicus.
Figure 5 see the fall of the number of highest value indicators of group 4 with a range between 0.75 and 0.85 starting in August.
Look that the number of points with a range of 0.5 and 0.8 of group one grows as a result of the loss of vegetable activity life
of group four.
Conclusion
Protected regions like the Gatun Lake reserve in Panama Canal do not behave uniformly during a drought crisis.
The emergency actions to conserve the soil moisture need different approaches according to the resilience level
of each segmented region. The Machine Learning K-Means grouping algorithm could help to classify region images
using European Copernicus Sentinel III or drones to identify the different courses of action during low moisture periods.